
Litecoin (LTC) is currently navigating a challenging technical landscape, with recent price action hinting at a possible short-term decline. As the cryptocurrency market remains volatile, LTC’s struggle to break above crucial resistance levels has caught the attention of both traders and analysts.
LTC Stalls at Resistance: What’s Happening?
Litecoin’s price recently attempted to recover but was firmly rejected at the $93–$95 range, a zone that aligns with its 200-day Exponential Moving Average (EMA) and the 50% Fibonacci retracement level. This rejection is significant, as it suggests that the recent upward move may be a “dead-cat bounce”—a brief recovery in a broader downtrend, rather than the start of a new rally.
Bearish Sentiment Builds in Derivatives Markets
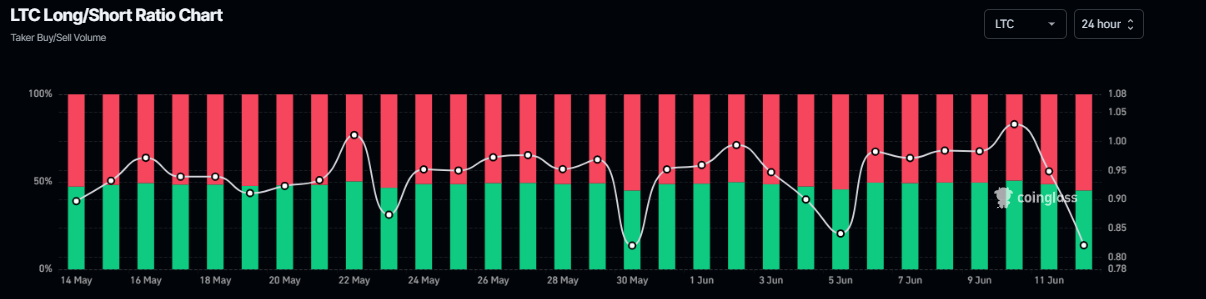
Market data from Coinglass shows that bearish bets on LTC have reached their highest level in over a month, with the long-to-short ratio dropping to 0.82. This means more traders are positioning for a price drop than a rise, reflecting a clear shift in sentiment toward the downside.
Technical Outlook: Key Levels to Watch
• Resistance Zone: $93.30–$95.18 (200-day EMA and 50% retracement)
• Immediate Support: $83.31 (recent local low)
• Next Major Support: $77.19 (weekly support level)
If LTC fails to break above the $96.30 resistance, the bearish scenario remains in play. A sustained move below $83.31 could open the door for further declines toward $77.19. Conversely, a close above $96.30 would invalidate the bearish thesis and could trigger a move toward the May high of $107.05.
Momentum Indicators: RSI Signals Indecision
The Relative Strength Index (RSI) is hovering around the neutral 50 mark, indicating a lack of clear momentum. For the bearish trend to gain traction, the RSI would need to dip below 50, confirming increased selling pressure.
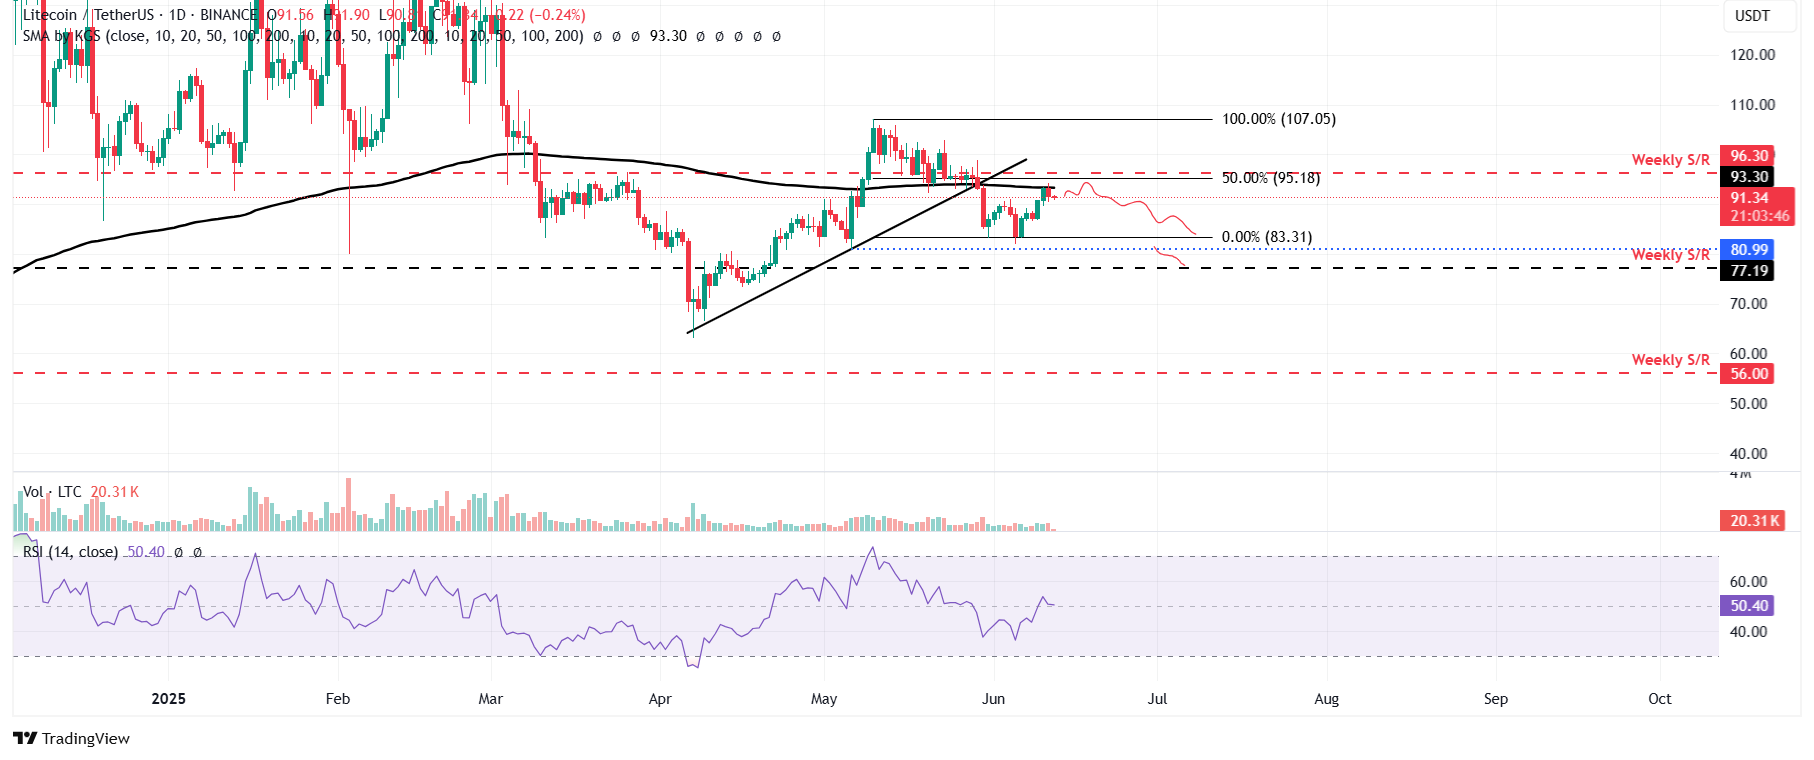
LTC/USDT daily chart
What’s Next for Litecoin?
With bearish sentiment rising and technical resistance holding firm, Litecoin may face additional downward pressure in the coming days. Traders are closely monitoring the $93–$95 range for potential shorting opportunities, while keeping an eye on support levels that could halt the decline.


