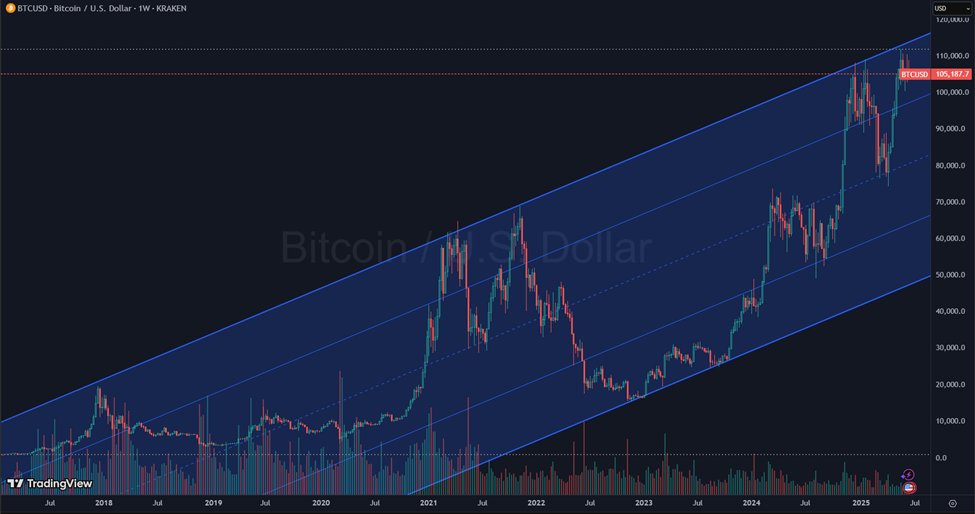
Bitcoin is testing a crucial resistance level that has capped every major bull run since 2017, trading near $110,000 as institutional interest and technical patterns collide. This multi-year trendline connects Bitcoin’s 2017 peak ($20,000), 2021 high ($69,000), and current 2025 price action. A decisive breakout could signal a new market phase, while rejection might trigger significant corrections.
The Decade-Defining Trendline
A simple parallel channel on Bitcoin’s weekly chart has guided prices for nearly eight years:
• Historical significance: Each touch of the upper boundary preceded major corrections (80% drop in 2018, 66% in 2022)
• Current test: Bitcoin faces this level again at ~$110,000 amid record ETF inflows and institutional adoption
• Market psychology: This zone historically combines late-cycle optimism with reversal risk, where greed meets technical reality
Upside breakout would require:
• Sustained closes above $112,000 with heavy volume
• Institutional buying overpowering retail sentiment
• Decoupling from traditional equity markets
Downside rejection could see:
• 30-40% retracements toward $70,000-$77,000 support
• Forced selling from institutional holders with risk mandates
• Strengthened correlation with Nasdaq volatility
New Market Dynamics at Play
Unlike previous cycles, today’s landscape features:
• Institutional dominance: ETFs, hedge funds, and corporate treasuries now control significant supply
• Structural vulnerability: These players may liquidate during volatility to meet risk requirements
• Technical divergence: While RSI shows bearish signals at current highs, EMAs suggest underlying strength (20-day: $105,586; 50-day: $103,709)
Strategic Considerations for Investors
1. Volume confirmation: Watch for high-volume breaks above $112,000 to validate upside
2. Macro alignment: Monitor Bitcoin’s behavior during equity selloffs for true strength signals
3. Risk management: Identify key support levels ($99,900-$105,000) for potential entry points
4. Sentiment indicators: Track long/short ratios and open interest for institutional positioning clues
Market structure suggests we’re at an inflection point where historical patterns meet unprecedented institutional participation. While the channel’s resistance demands respect, fundamental shifts in ownership could rewrite Bitcoin’s technical playbook.