Washington’s “Crypto Week” could provide the regulatory clarity Ripple has long awaited, as key on-chain data signals growing investor conviction and network adoption, setting the stage for a potential challenge to its $3.40 all-time high.
XRP is consolidating its recent gains, trading firmly around the $2.95 mark after a brief push above $3.00 earlier this week. While the market catches its breath, a powerful confluence of legislative momentum in the U.S. and strengthening market fundamentals is fueling speculation that this is more than a temporary rally. The ultimate prize for bulls is the longstanding record high of $3.40, a peak not seen since January.
The Political Catalyst: U.S. Crypto Bills in the Spotlight
The primary driver of the current optimism stems from Washington D.C. A trio of cryptocurrency-focused bills is under discussion, potentially ending years of regulatory ambiguity. Following a procedural setback, President Donald Trump has actively intervened to rally support for the legislation.
Key bills on the table include:
• The GENIUS Act: A framework for regulating stablecoins, which recently passed the Senate.
• The CLARITY Act: A bill aimed at establishing clear rules for digital assets.
• The Anti-CBDC Surveillance State Act: Legislation addressing central bank digital currencies.
House Representative French Hill has publicly stated his confidence that there are sufficient votes to pass all three measures. For a company like Ripple, which issues both the XRP token for its cross-border Ripple Payments system and the institution-focused RLUSD stablecoin, this legislative package could be a game-changer. Regulatory clarity would not only legitimize its operations in the U.S. but also pave the way for wider adoption and institutional partnerships.
Decoding the Data: What On-Chain Metrics Reveal
Beyond the political headlines, XRP’s on-chain activity paints a compelling, albeit mixed, picture of market sentiment.
Investor interest in XRP derivatives has surged. Futures Open Interest—the total value of outstanding futures contracts—has more than doubled in under a month, climbing from $3.54 billion on June 23 to a substantial $7.9 billion. This sharp increase indicates a significant flow of new capital and conviction from traders betting on future price appreciation.
However, the derivatives market has also shown signs of instability. A 45% drop in 24-hour trading volume to $13 billion followed the recent price volatility around the $3.00 level. Lower volumes can sometimes hinder a sustained price climb.
On a more fundamental level, the XRP network itself is showing signs of robust growth. The number of new addresses being created on the XRP Ledger has reversed a previous downtrend, averaging 8,690 on Monday. This metric is a key indicator of rising user adoption and demand for the underlying asset, providing a strong foundation for a potential price rally.
The Technical Outlook: Bullish Signals Tempered with Caution
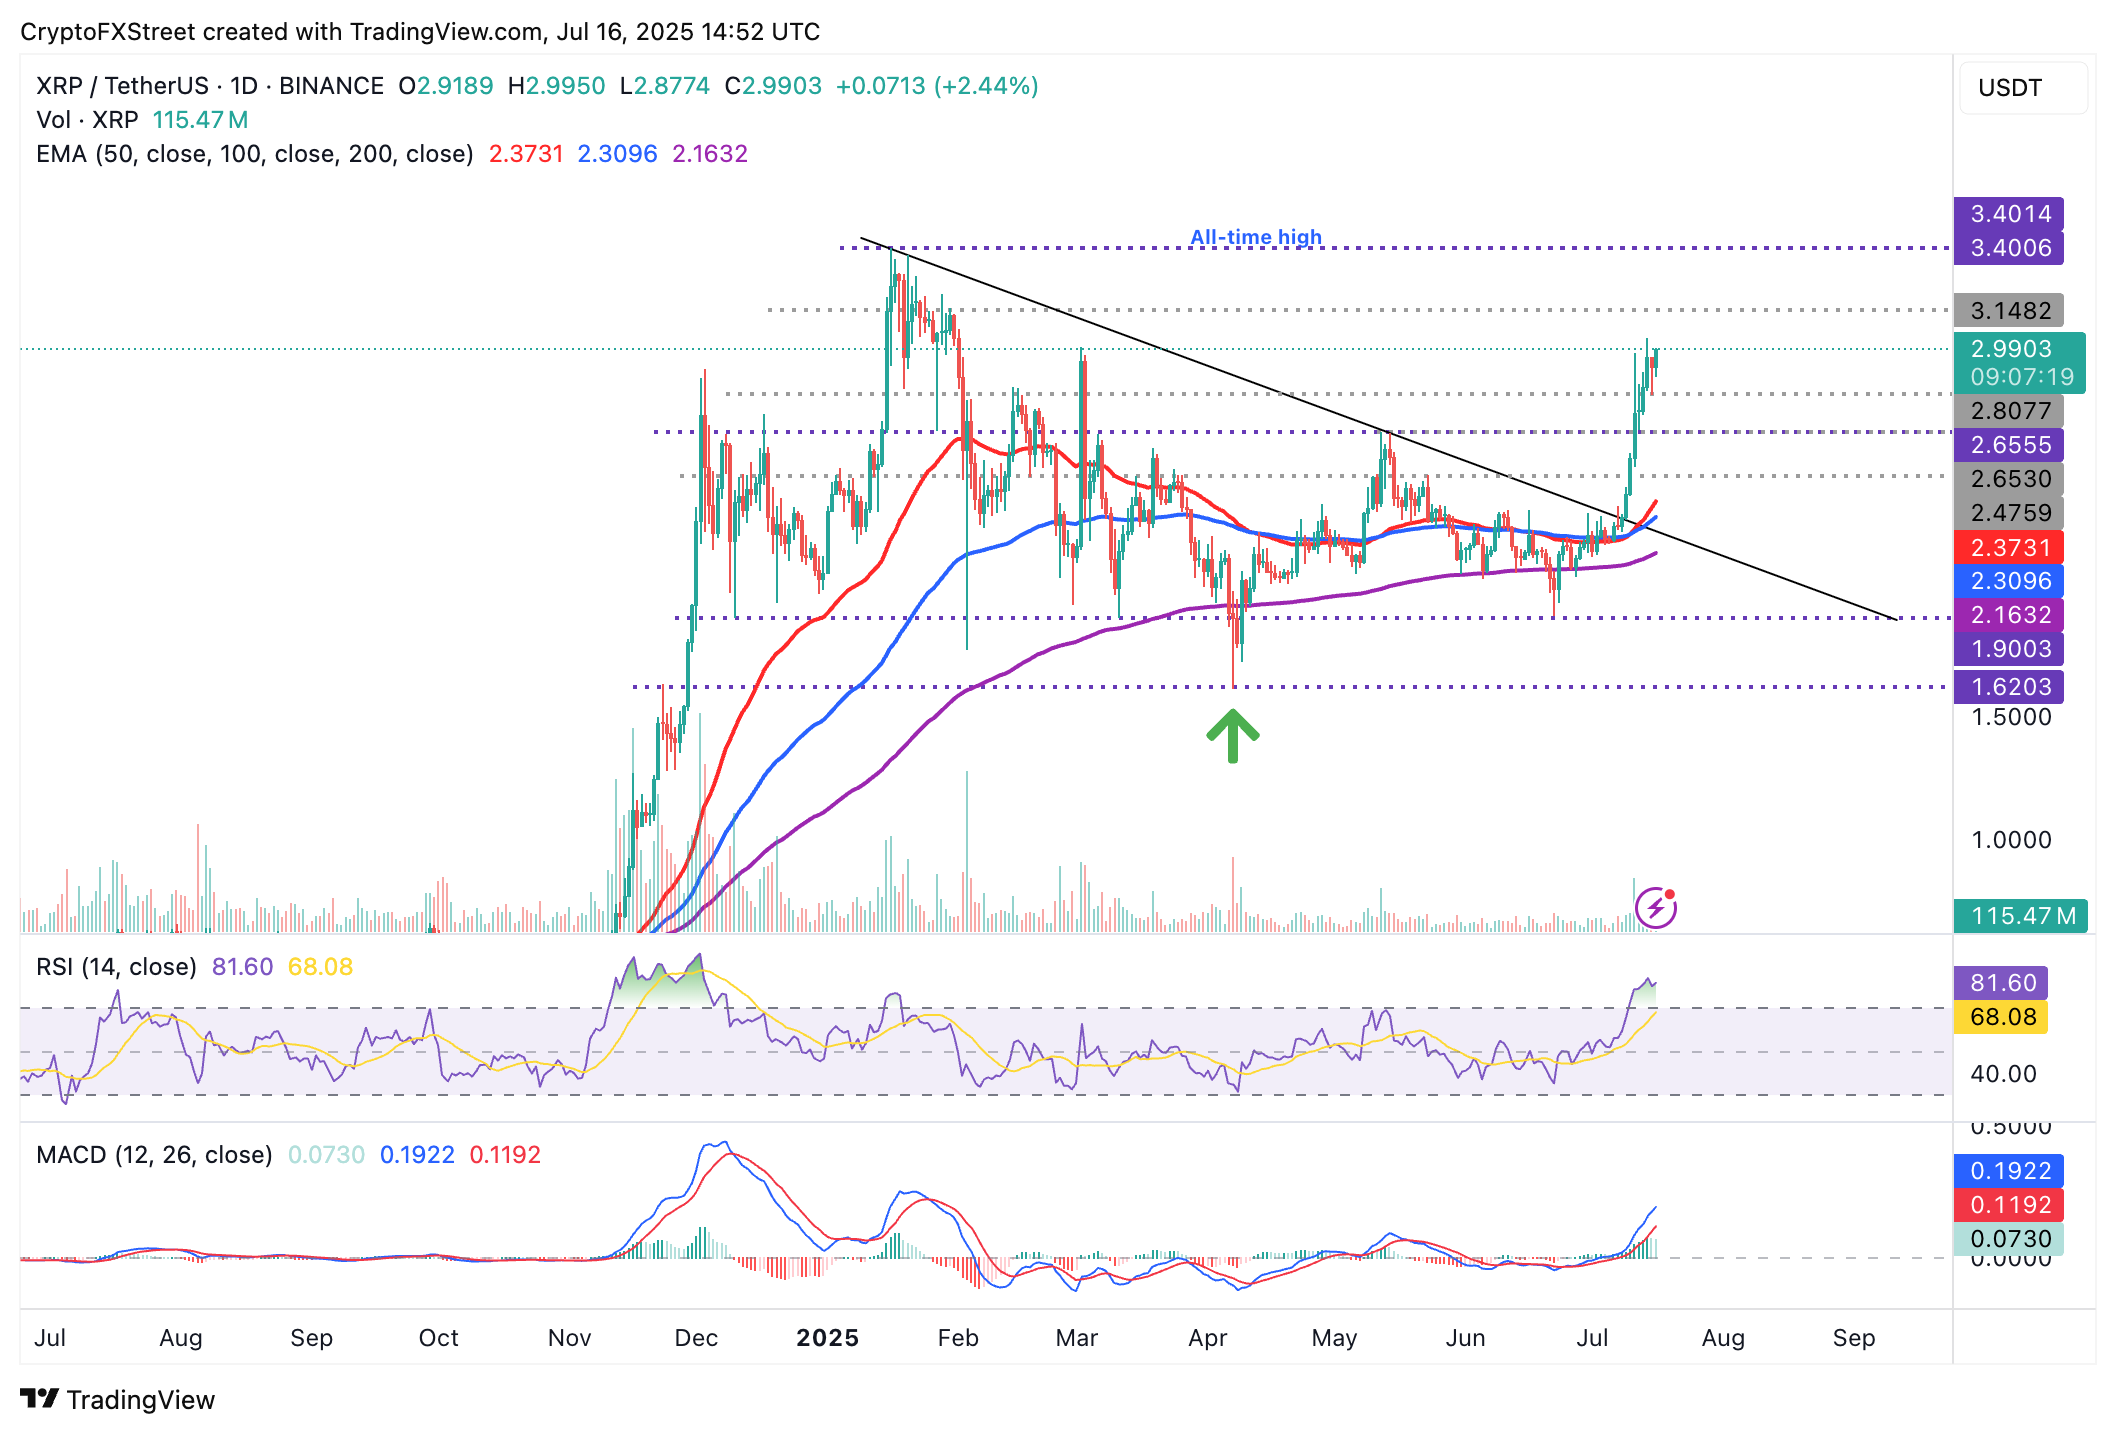
From a technical standpoint, XRP’s position remains strong. The price is trading comfortably above several key support levels:
• 50-day EMA: $2.37
• 100-day EMA: $2.30
• 200-day EMA: $2.16
The Moving Average Convergence Divergence (MACD) indicator continues to flash a buy signal, a trend that has been in place since late June. As long as the blue MACD line remains above the red signal line, the bullish momentum is considered intact. A decisive break and close above the psychological $3.00 barrier would likely ignite further buying pressure, clearing the path for a run toward the $3.40 record.
However, traders should exercise caution. The Relative Strength Index (RSI) is currently in overbought territory at 81. An RSI reading above 70 often suggests that an asset is overextended and could be due for a correction. A pullback could see the price re-test support levels, potentially as low as the 50-day EMA at $2.37.

XRP/USDT daily chart
Disclaimer: This article is for informational purposes only and should not be taken as financial advice. Always conduct thorough research before making investment decisions.


