

Ethereum is currently at a critical juncture, balancing on a knife’s edge between fresh investor optimism and stark technical warnings. While the digital asset maintains a price above the $4.200 mark, showcasing impressive monthly gains of 15,3%, a confluence of bearish chart patterns threatens to erase recent progress and pull the price towards the key psychological support of $4.000.
A Surge of Fresh Capital Meets Dwindling Supply
On-chain data reveals a significant influx of short-term interest, suggesting traders are actively “buying the dip” following Ethereum’s recent retreat from its all-time high. Analysis of HODL waves indicates a notable shift in supply distribution over the last 30 days.
- The cohort of wallets holding ETH for one day to one week has expanded from 2,8% to 3,39% of the total supply.
- Similarly, wallets holding for one week to one month have increased their share substantially, from 6,3% to 8,5%.
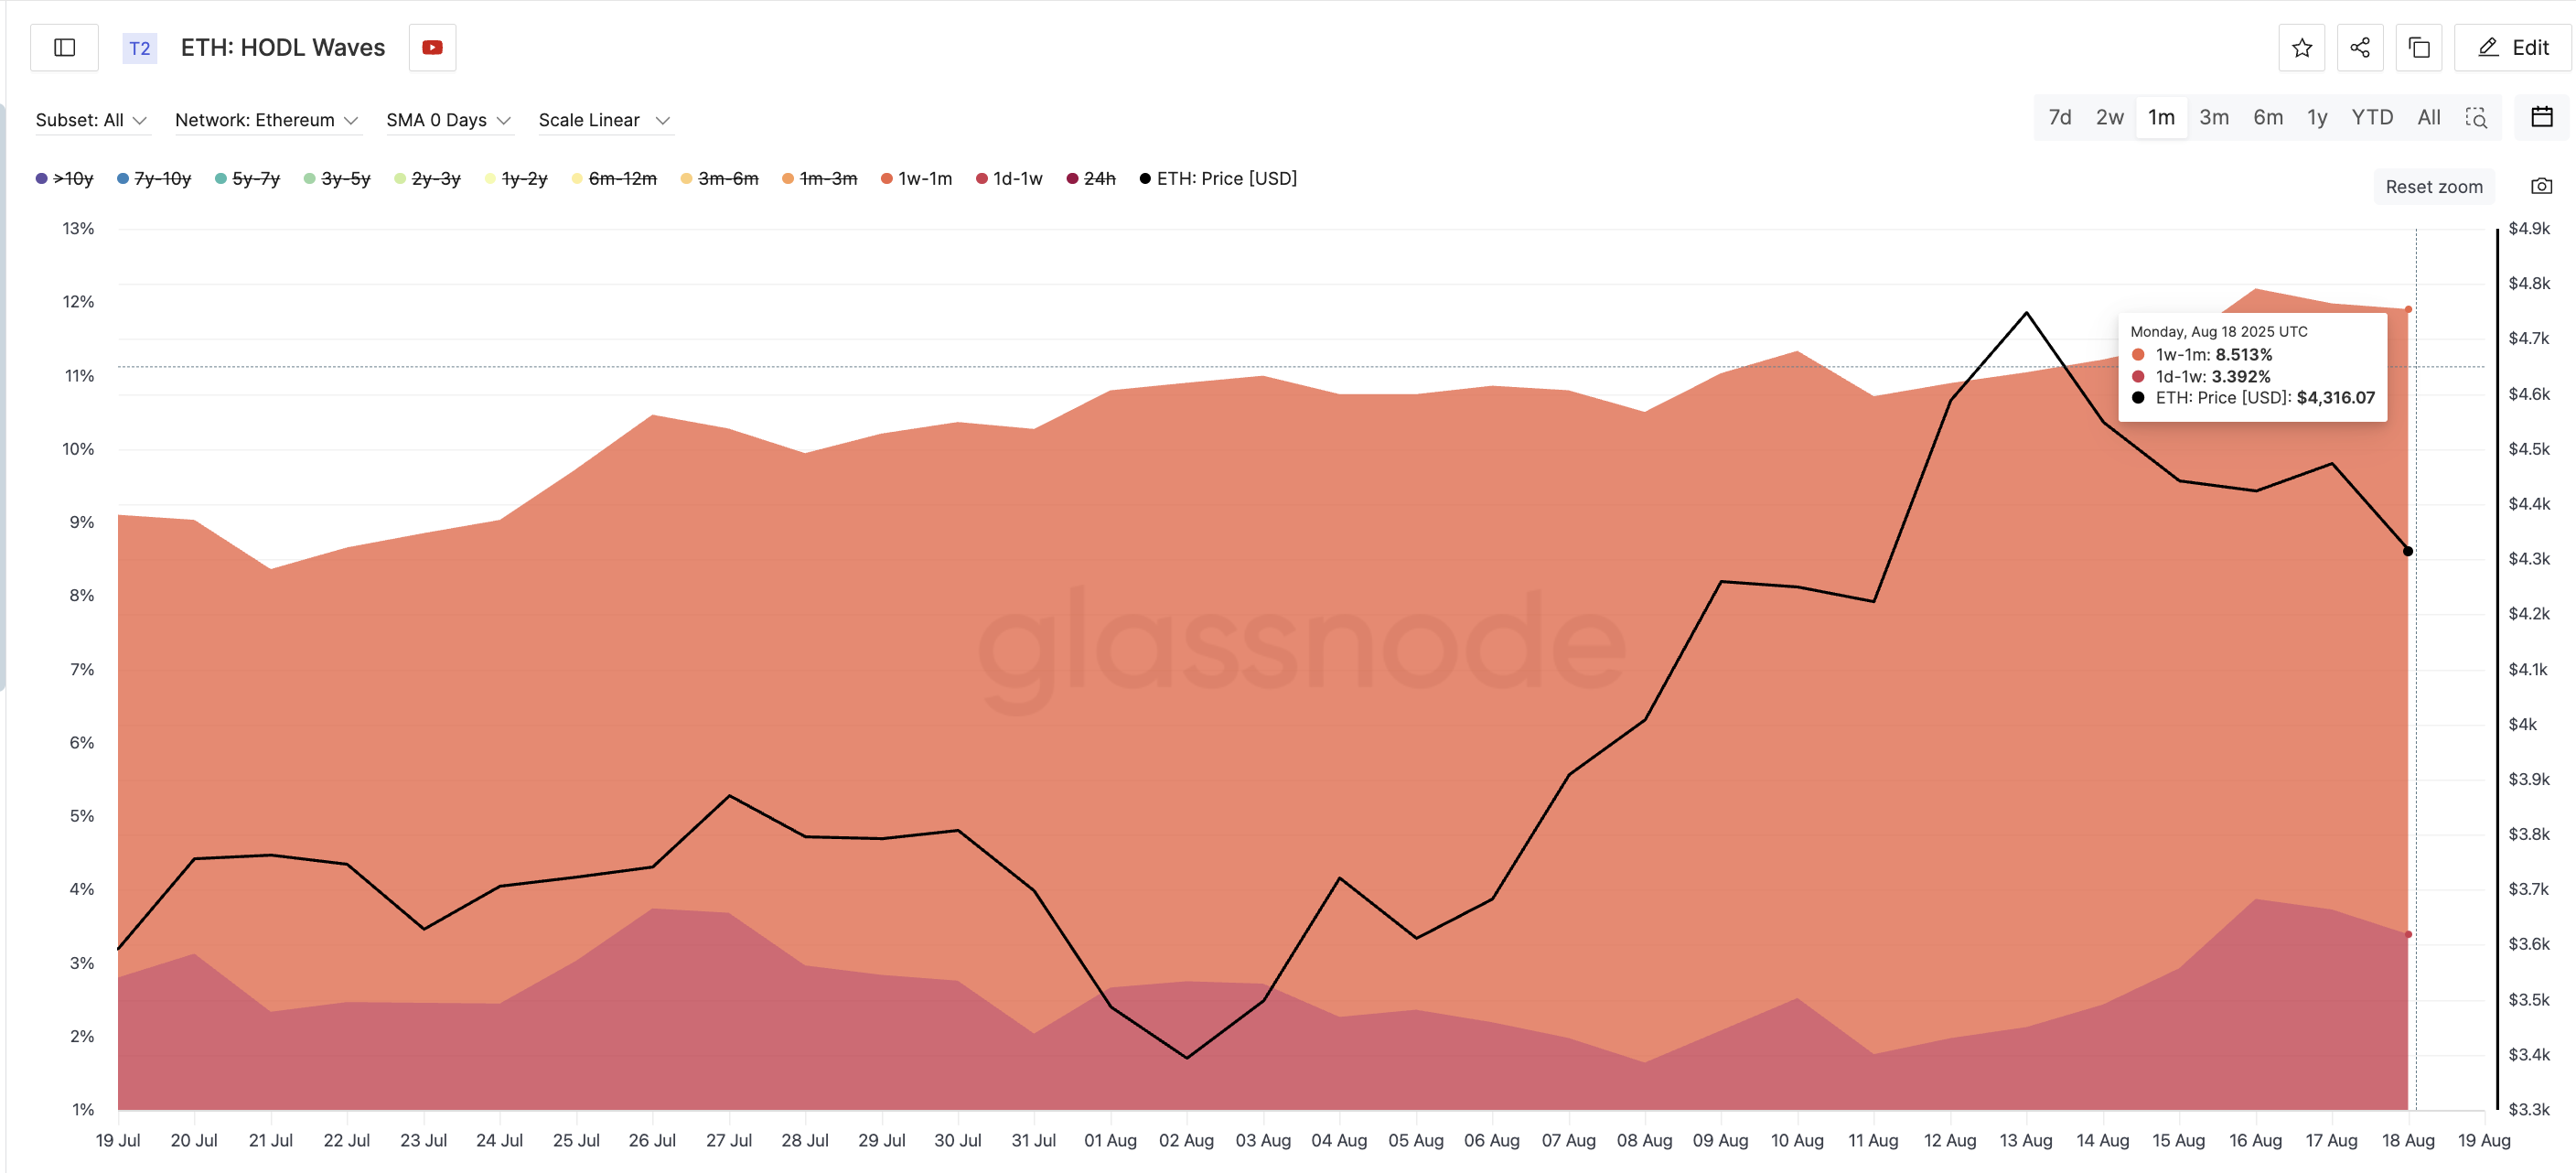
Source ETH price/ HODL waves: Glassnode
This trend points to renewed buying activity and growing confidence among new market participants. Underpinning this bullish sentiment are the historically low levels of Ethereum reserves on exchanges. Despite minor inflows, the total reserve hovers near a nine-year low at approximately 18,404 million ETH. Low exchange reserves traditionally signal reduced immediate selling pressure, as more assets are held in private wallets for longer-term investment rather than being staged for a quick sale.
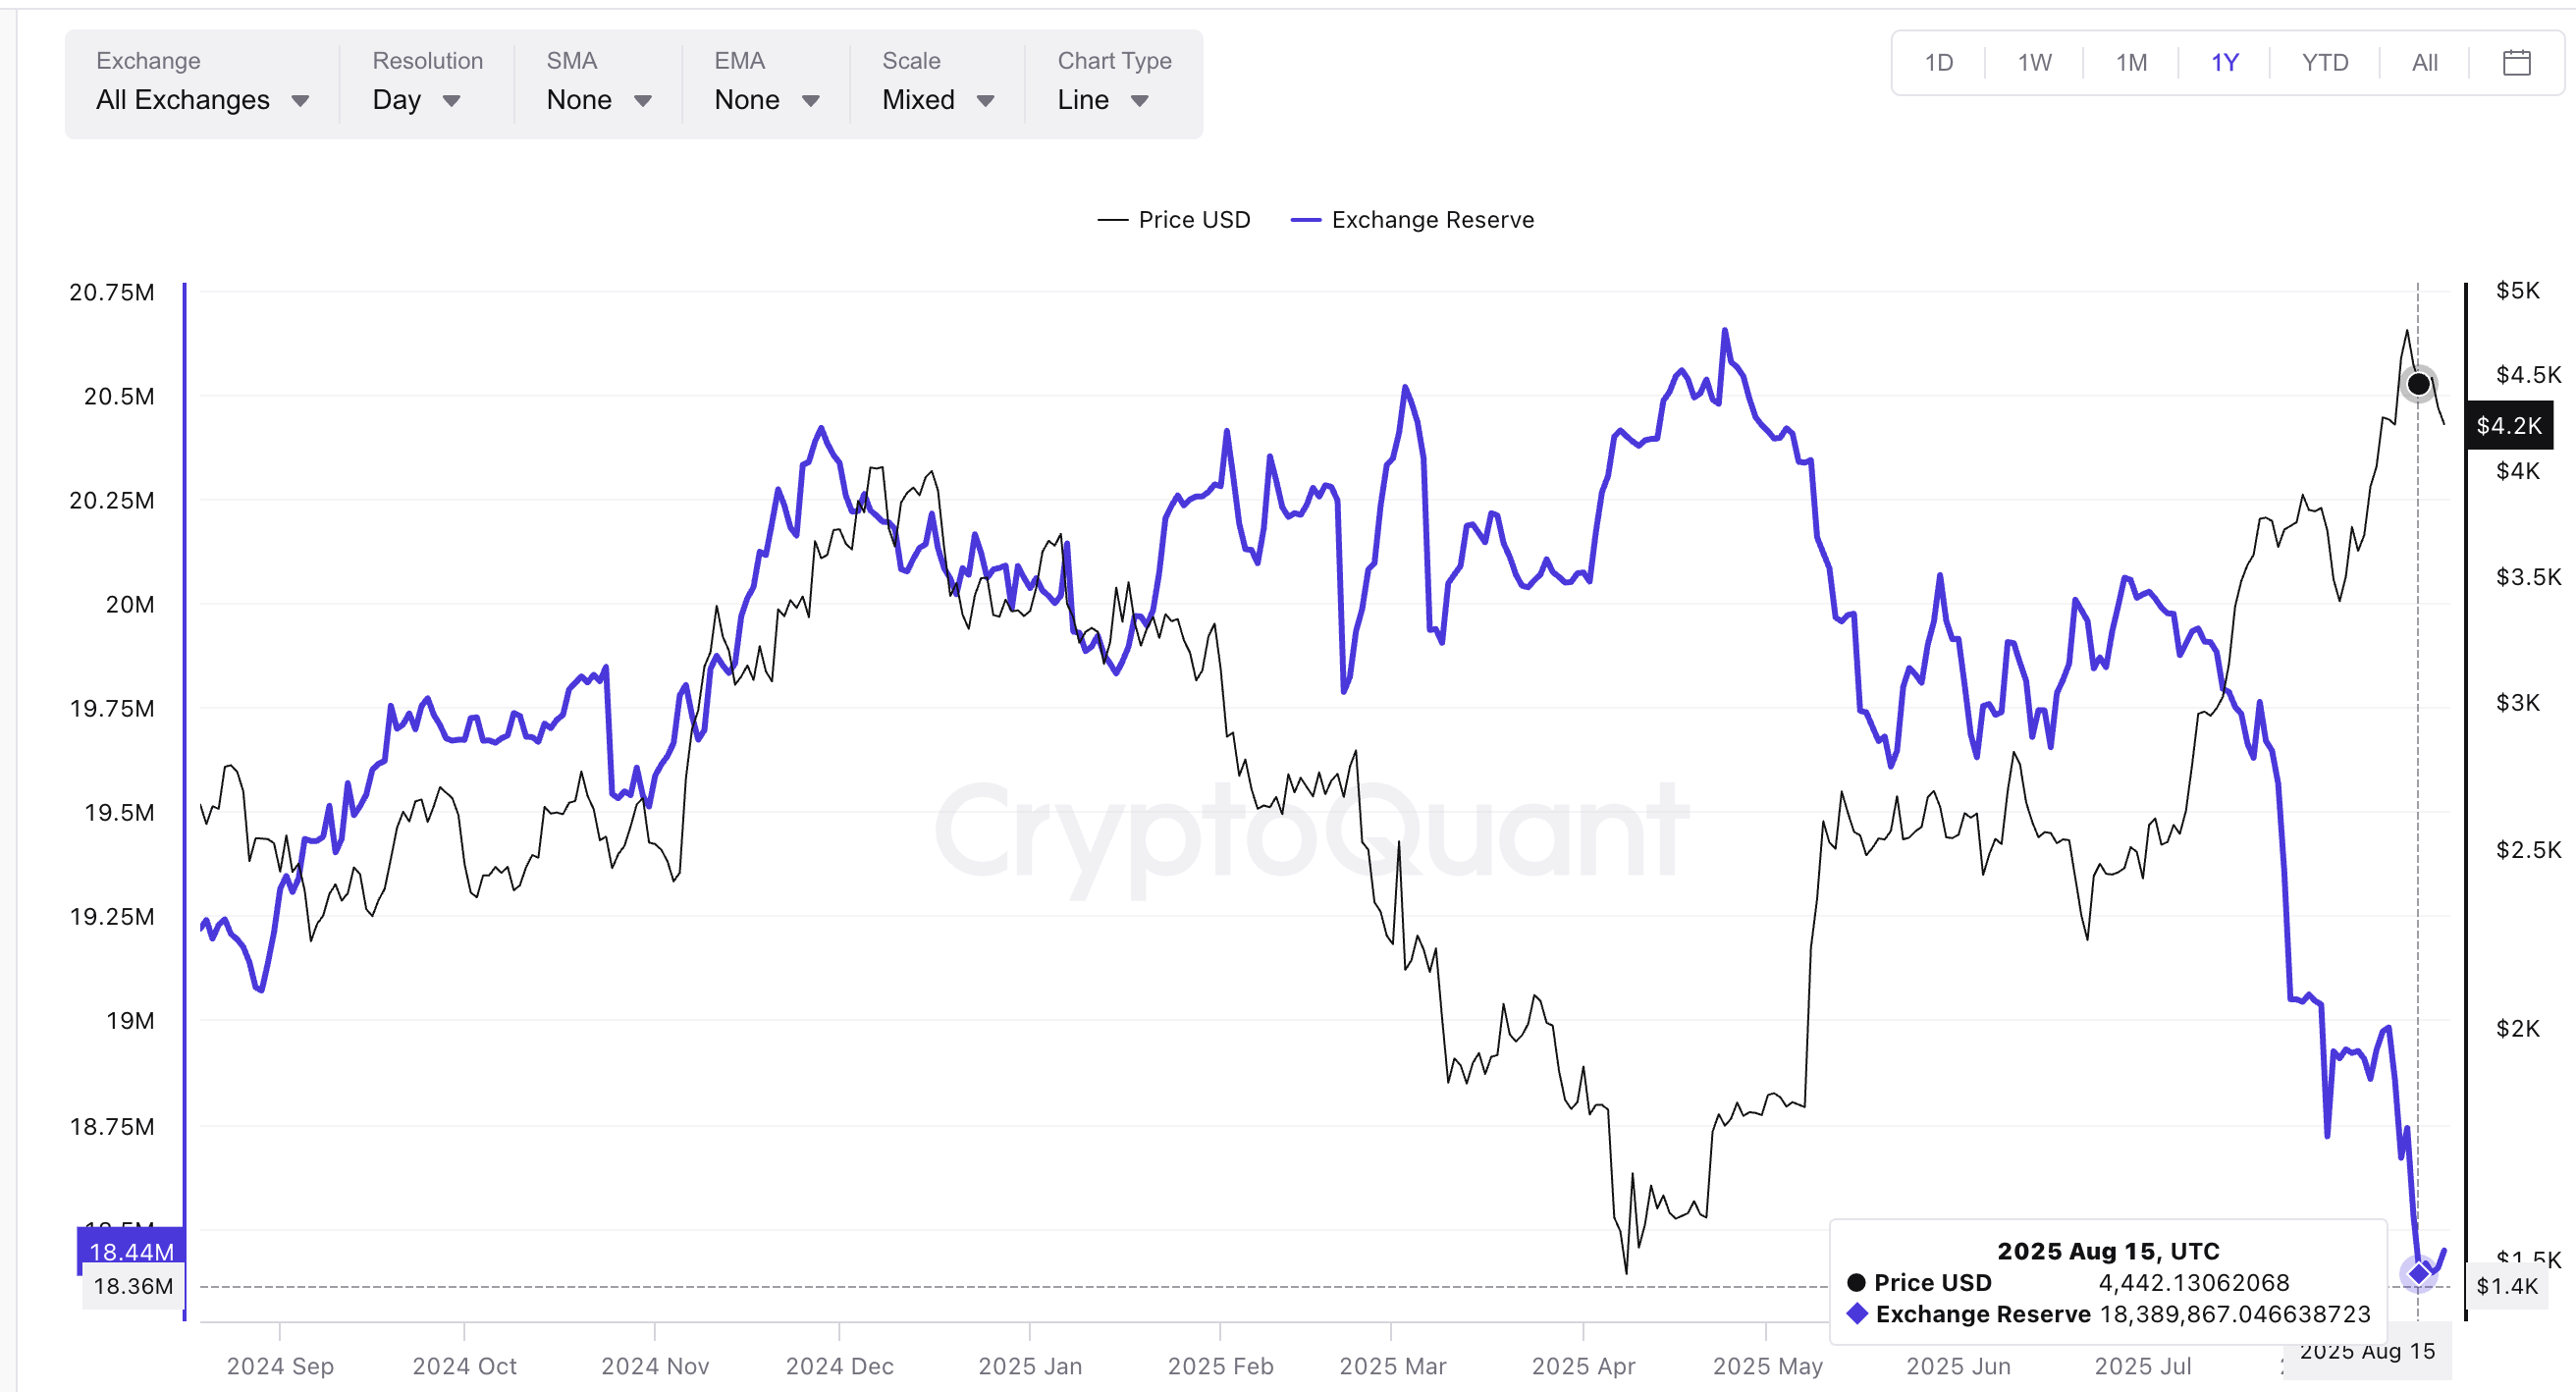
Source: Cryptoquant
The Technical Storm on the Horizon
Despite the encouraging on-chain metrics, the short-term technical outlook paints a far more cautious picture. On the 4-hour chart, two potent bearish signals are converging.
First, the price is consolidating within a descending triangle, a classic continuation pattern that typically resolves to the downside. This formation suggests that sellers are growing more aggressive at progressively lower prices.
Second, and more critically, the 20-period Exponential Moving Average (EMA) is on the verge of crossing below the 50-period EMA. This event, known to traders as a “death cross,” is a widely recognized indicator of weakening momentum and often precedes a significant price decline.
Key Price Levels to Monitor
The confluence of these patterns places Ethereum in a precarious position. The asset is currently testing a critical support zone between $4.216 and $4.189. According to market heatmaps, the demand in this area is weak.
A decisive break below this floor would validate the bearish technicals and likely trigger a rapid selloff. With limited support below, the next logical target for sellers would be the $4.006 level.
For the bearish outlook to be invalidated, bulls would need to mount a strong defense and push the price back above $4.378. Reclaiming this level would not only break the structure of the descending triangle but could also turn the threatening EMA lines back into dynamic support, shifting momentum back in favour of a recovery.
Disclaimer: This article is provided for informational purposes only and does not constitute financial advice. Investors should always conduct their own thorough research and consult with a qualified financial advisor before making any investment decisions in cryptocurrencies, which are highly volatile and speculative assets.
You might be interested in: