

Bitcoin has staged a robust comeback, rebounding over 10% from a recent dip to the $98,000 region and now trades just below a crucial resistance level. This move has caught the attention of both retail and institutional investors, as the cryptocurrency forms a classic bull flag pattern on higher timeframes—a technical signal often associated with the potential for further upward momentum.
Market Context: Fundamentals and Sentiment
Several macro factors are aligning in Bitcoin’s favor. Geopolitical tensions, particularly in the Middle East, have eased for now, reducing risk-off sentiment in global markets. Additionally, expectations for a possible U.S. interest rate cut in September are fueling optimism, as lower rates typically benefit risk assets like cryptocurrencies.
Technical Picture: The $109,000 Barrier
Bitcoin is now less than 1% away from testing the upper boundary of its current trend channel, with the key resistance zone sitting at approximately $108,800–$109,100. This area is significant for two reasons:
• Value Area High: The upper end of the recent trading range, calculated from the swing high ($111,980) to the swing low ($98,200), lands at $108,831.
• Fibonacci Resistance: The 78.6% retracement of the same move is at $109,097, reinforcing the importance of this level.
A decisive break above this resistance could open the door for Bitcoin to set new all-time highs, potentially marking the final leg of the current bull cycle.
Possible Scenarios: Breakout or Pause?
Bullish Breakout:
If Bitcoin manages to close above $109,000 with strong volume, it could trigger a wave of buying, pushing the price into uncharted territory. A successful retest of this level as support would further validate the breakout, with analysts eyeing targets above $112,000 in the near term.
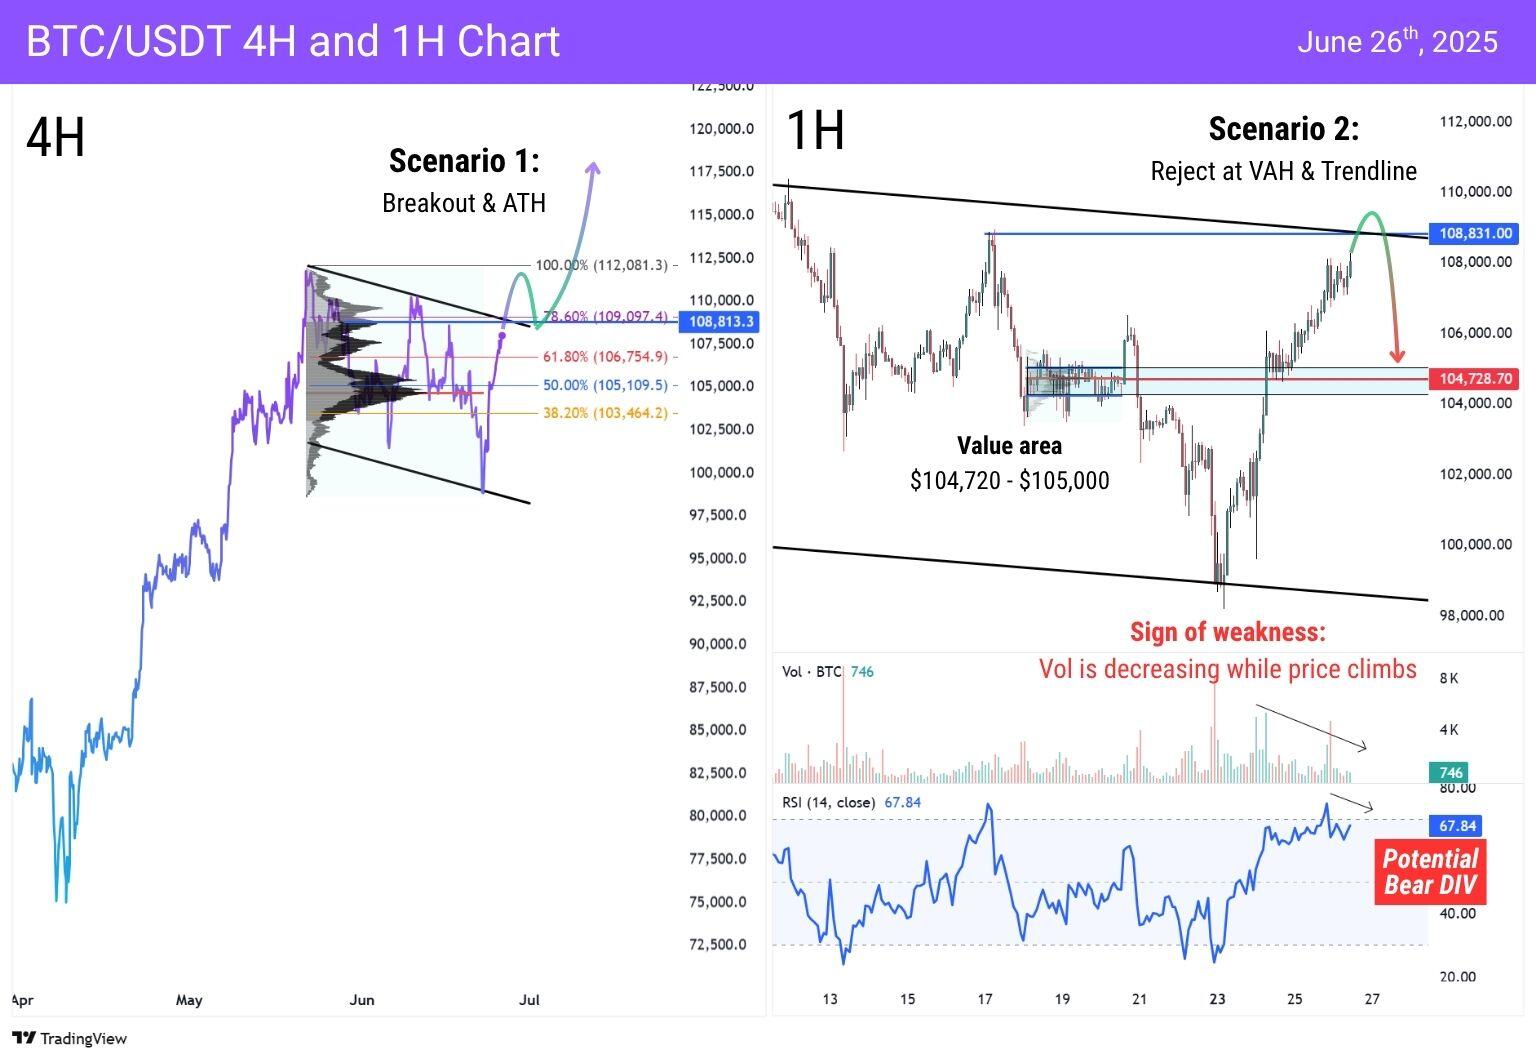
Consolidation or Rejection:
On the other hand, if Bitcoin fails to overcome this resistance, a pullback toward the $104,700–$105,000 zone is likely. This area served as a previous consolidation range and includes the Point of Control (POC) at $104,728, a level where significant trading activity has occurred. Should this support fail, a deeper correction toward $103,000 could follow.
Investor Takeaways
• Momentum remains positive, but declining trading volumes and potential bearish divergences on the RSI suggest caution is warranted.
• Macro catalysts—such as U.S. monetary policy and geopolitical developments—could quickly shift the outlook.
• Technical levels to watch: $109,000 (resistance), $105,000 (support), and $103,000 (deeper support).
For those tracking the next move, a confirmed breakout above $109,000 could signal the start of a new phase for Bitcoin, while a rejection may offer a buying opportunity at lower levels.