After touching a new all-time high of $123.000, Bitcoin has pulled back in a significant profit-taking event led by some of its most seasoned holders. On-chain data reveals this healthy correction also exposes a structural vulnerability that could fuel short-term volatility.
Bitcoin (BTC) experienced a swift reversal this week, retreating from its record peak of $123.000 on Monday to trade below the $117.000 mark. The nearly 5% downturn coincided with one of the year’s largest profit-realization waves, as investors moved to lock in gains from the recent explosive rally.
The $3,5 Billion Cash-Out: Who’s Selling?
According to on-chain analytics firm Glassnode, the market saw a staggering $3,5 billion in profits realized over a single 24-hour period.
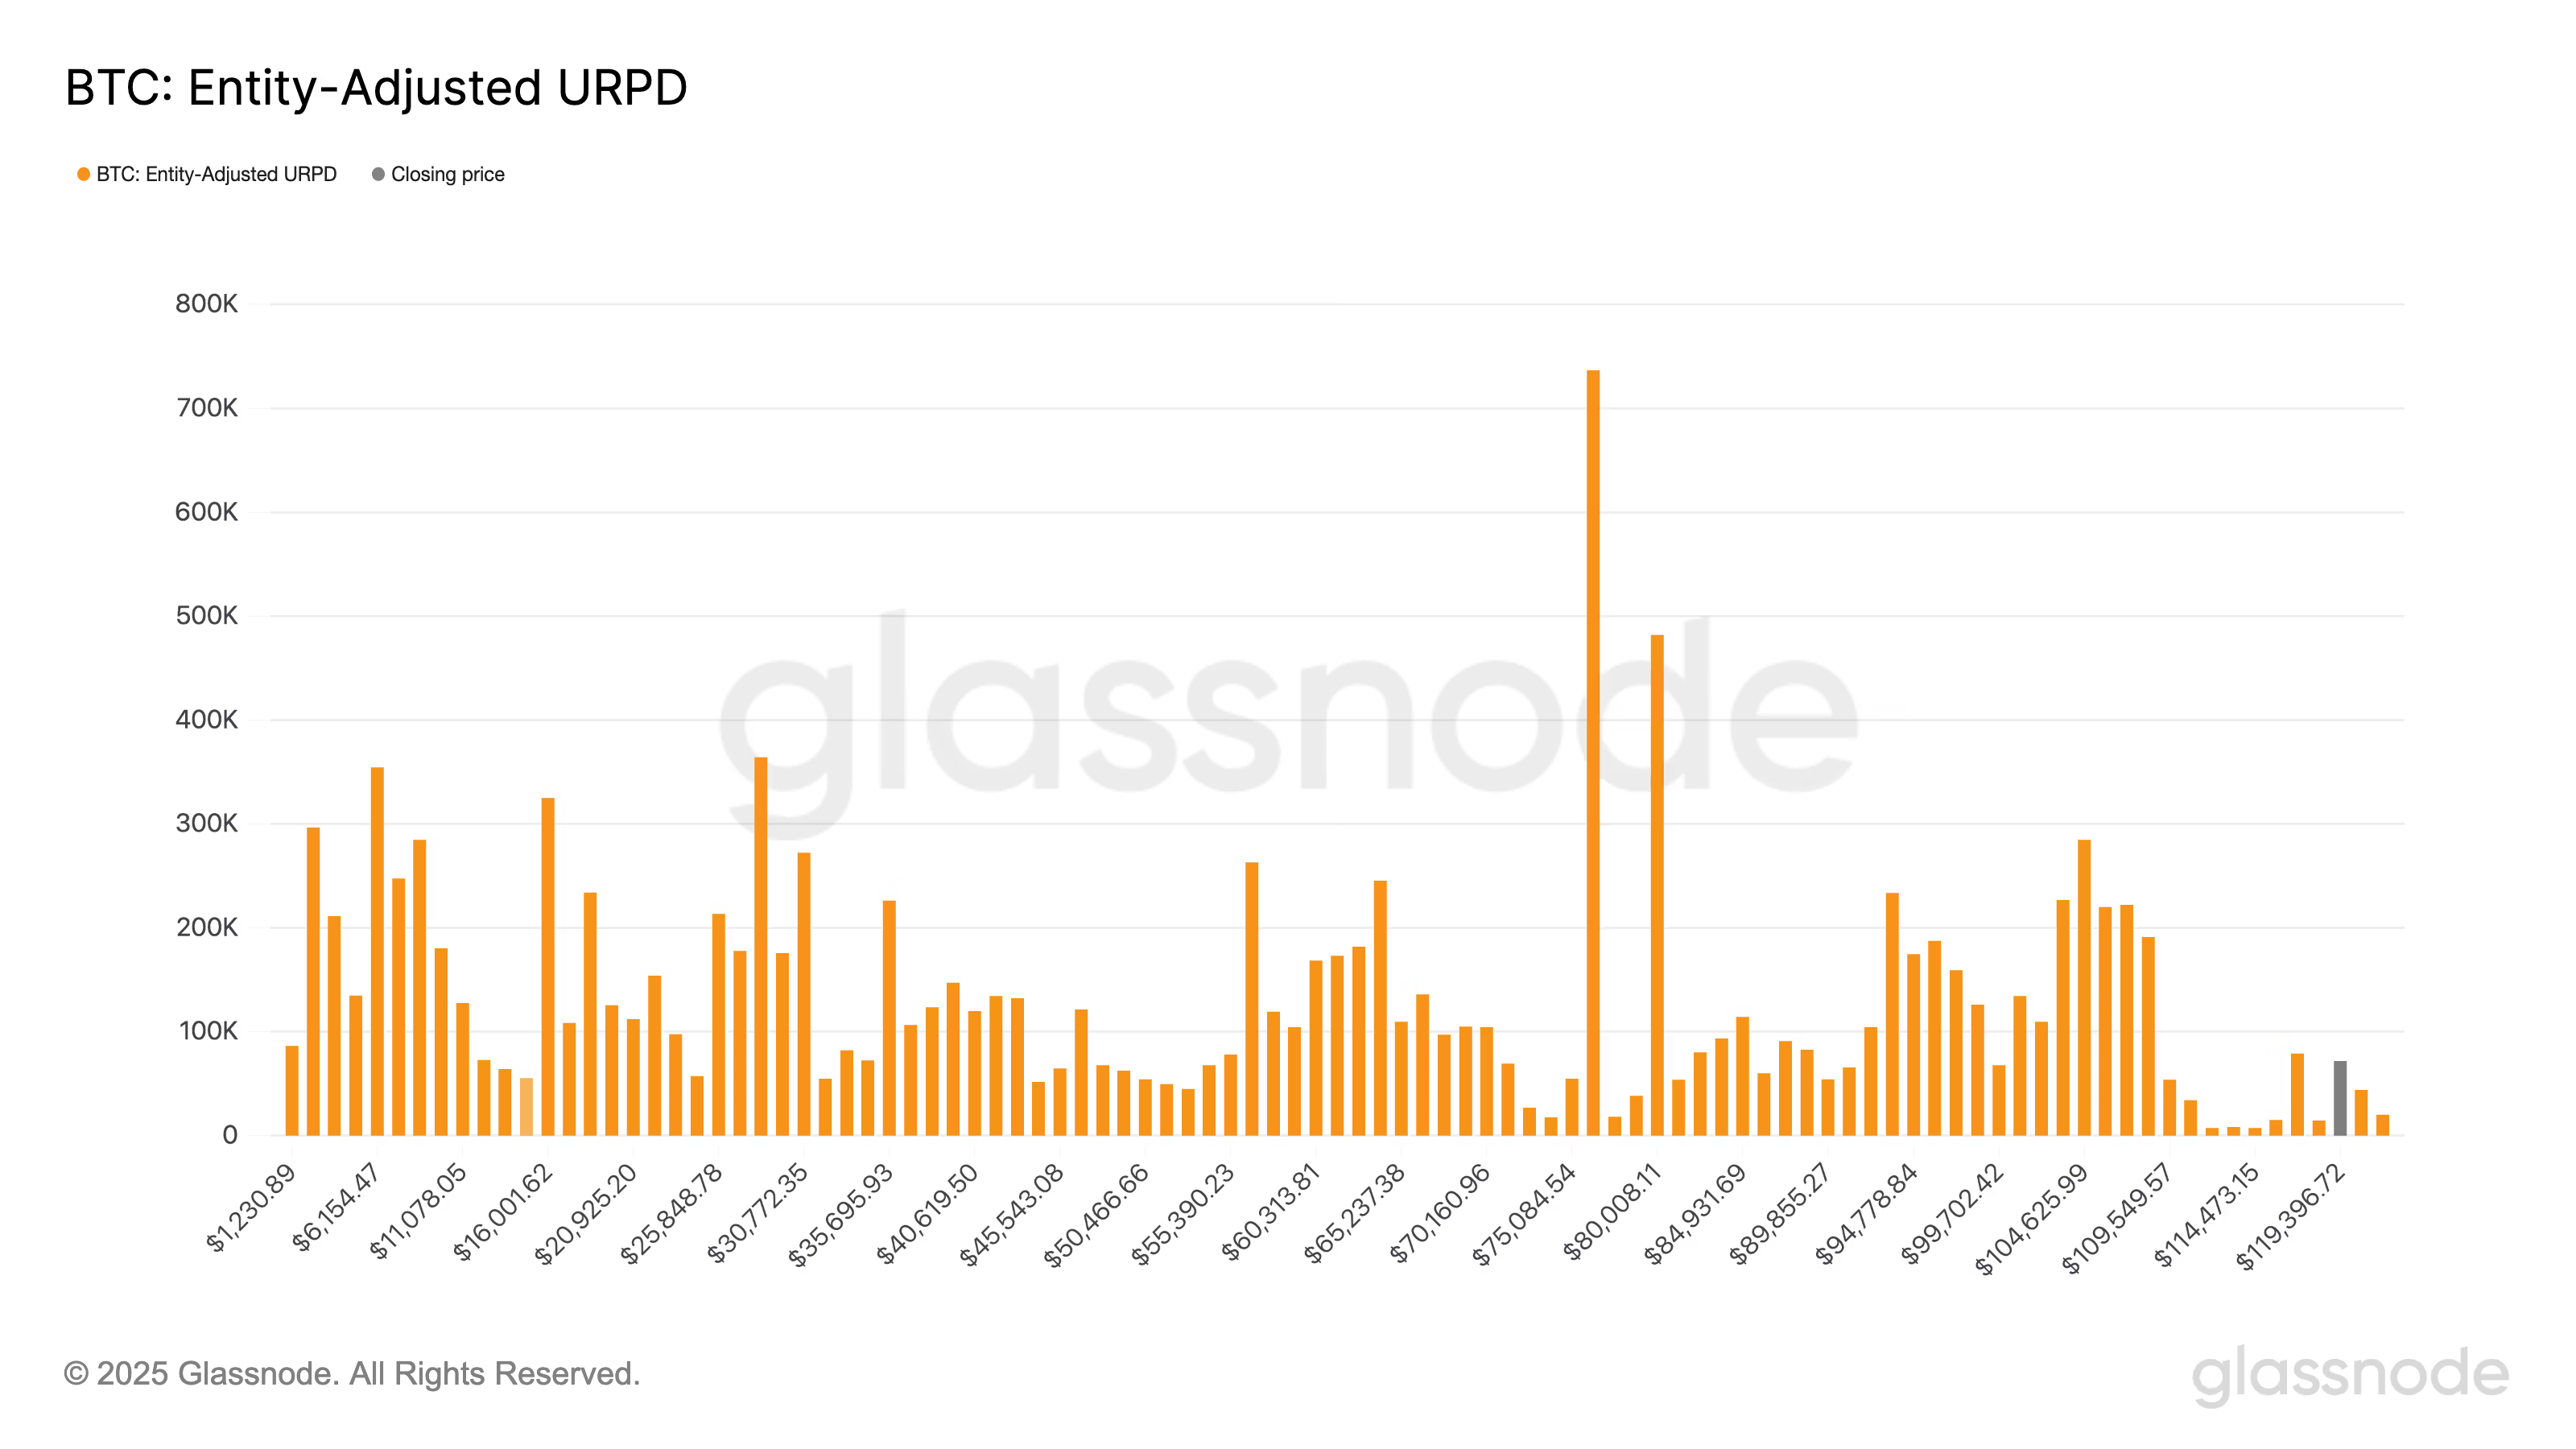
Glassnode’s UTXO Realized Price Distribution (URPD) sheds light on the move. It measures the so-called unspent transaction outputs (UTXO), which capture the prices at which bitcoin was bought and not sold. It represents the prices at which BTC is currently being held across the Bitcoin blockchain.
Digging deeper into the data, the most significant selling pressure came not from new speculators, but from long-term holders. These veteran investors, defined as wallets that have held Bitcoin for more than 155 days, accounted for a majority (56%) of the total profits taken. This suggests that experienced market participants viewed the new price highs as an opportune moment to de-risk and secure their earnings.
On-Chain Data Reveals a Vulnerable Price Zone
The speed of Bitcoin’s recent ascent from $108.000 to over $123.000 has created a potential air pocket in the market’s structure. Because the price moved so quickly, relatively little trading volume actually occurred between the $110.000 and $116.000 levels.
This phenomenon is highlighted by Glassnode’s URPD chart, which maps the prices at which the current supply of Bitcoin was last purchased. The chart shows a noticeable dip in this range, indicating a lack of a strong historical support base.
| Key Metric | Current Value | Market Implication |
| All-Time High | $123.000 | New psychological resistance level. |
| 24h Realized Profit | $3,5 billion | High selling pressure; investors securing gains. |
| Long-Term Holder Share | 56% | Indicates profit-taking by experienced investors. |
| Key Support Gap | $110.000 – $116.000 | Lack of historical volume may lead to high volatility. |
This “supply gap” means the market is vulnerable. Should selling pressure continue, the price could fall through this zone quickly. Conversely, a rebound in buying could see Bitcoin shoot back up through this thin liquidity range with equal speed.
For now, the pullback appears to be a healthy market correction driven by logical profit-taking. However, traders will be watching the $110.000 – $116.000 zone closely as a key indicator of short-term market strength and direction.
Disclaimer: This article is for informational purposes only and should not be taken as financial advice. Always conduct thorough research before making investment decisions.