TRON (TRX) has emerged as a standout performer in the volatile cryptocurrency market, demonstrating remarkable resilience and a sustained upward trajectory. While major digital assets like Bitcoin have faced corrections, TRX has not only held its ground but has surged, signaling strong investor confidence and a potential breakout to new all-time highs.
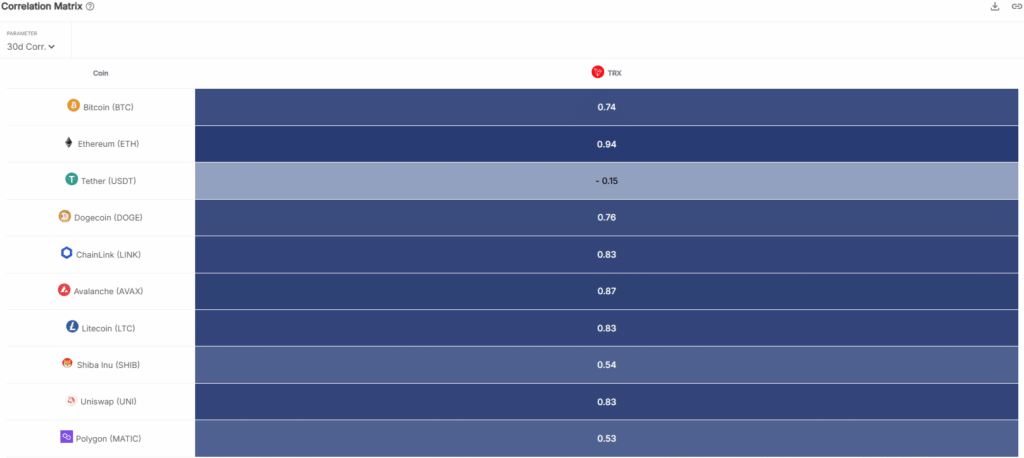
Since mid-July, TRON has recorded an impressive 8,85% rally, contrasting sharply with Bitcoin’s 3,5% decline over the same period. This divergent performance underscores TRON’s independent market dynamics, further evidenced by its robust positive correlation with Ethereum (ETH) at 0,94, compared to a lesser 0,74 correlation with Bitcoin (BTC). This unique positioning suggests that TRX’s price movements are increasingly influenced by the broader altcoin market and its specific ecosystem developments rather than solely trailing Bitcoin’s lead.

Source: IntoTheBlock
Unpacking TRX’s Market Structure and Key Levels
Analysis of TRON’s 1-day chart reveals a distinctly bullish market structure. The token successfully broke past a significant local high on 29 July, initiating a clear bullish shift. Following this breakthrough, TRX prudently retraced to the crucial $0,32 demand zone, a level where it found substantial support and rebounded. This retest and subsequent bounce from a key support area are classic indicators of a healthy uptrend, attracting fresh buying interest.
Trading volumes for TRX in July have been consistently strong, generally remaining above the 20-day moving average, which further validates the underlying strength of the recent price movements. The Chaikin Money Flow (CMF), an indicator of money flow volume, has consistently stayed above +0,05, reflecting persistent buying pressure. While the Money Flow Index (MFI) briefly dipped below 50, it did not indicate a significant bearish reversal, suggesting that the recent cooling of momentum is likely temporary and that the prevailing bullish sentiment is set to continue.
Short-Term Outlook and Critical Thresholds
Examining the 4-hour chart, it’s evident that momentum has been somewhat muted over the past couple of days. However, the 50-period moving average has continued to act as a dynamic support level. This confluence of the 50-period moving average with the robust $0,32 demand zone creates a strong foundational support for TRX.
For swing traders and short-term investors, the $0,32 mark represents a critical threshold. A sustained price drop below this level would be the first significant sign of short-term bearishness, warranting caution. However, as long as TRON maintains its position above this support, the path remains open for a push towards the next key resistance at $0,35, with the potential to challenge and surpass its previous all-time highs in the coming weeks.
TRON’s ability to forge its own path amidst broader market fluctuations, coupled with strong technical indicators, positions it as a compelling asset to watch. Its continued strength could redefine expectations for altcoin performance in the current market cycle.
Disclaimer: This article is provided for informational purposes only and does not constitute financial advice. Investors should always conduct their own thorough research and consult with a qualified financial advisor before making any investment decisions in cryptocurrencies, which are highly volatile and speculative assets.
You might be interested in:


